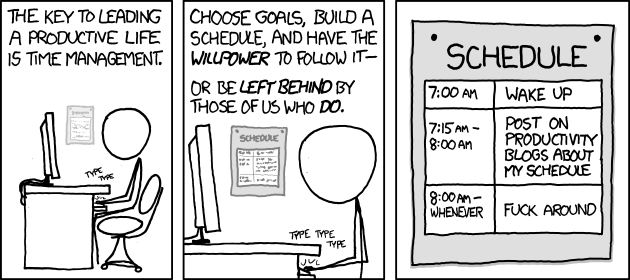
Just to prove a point - the 2x2 grid is the best way to show-off pretty much interesting statistic or insight
Source: Nolan Chart - XKCD
Tags:Read more from my blog for an introduction and quick tips on developing in Hugo or UCTD.
Meet the author

Damien Saunders
An experienced management consultant and business leader interested in digital transformation, product centred design and scaled agile. If I'm not writing about living with UCTD (an autoimmune disease), I'm probably listening to music, reading a book or learning more about wine.
Find our more about me.